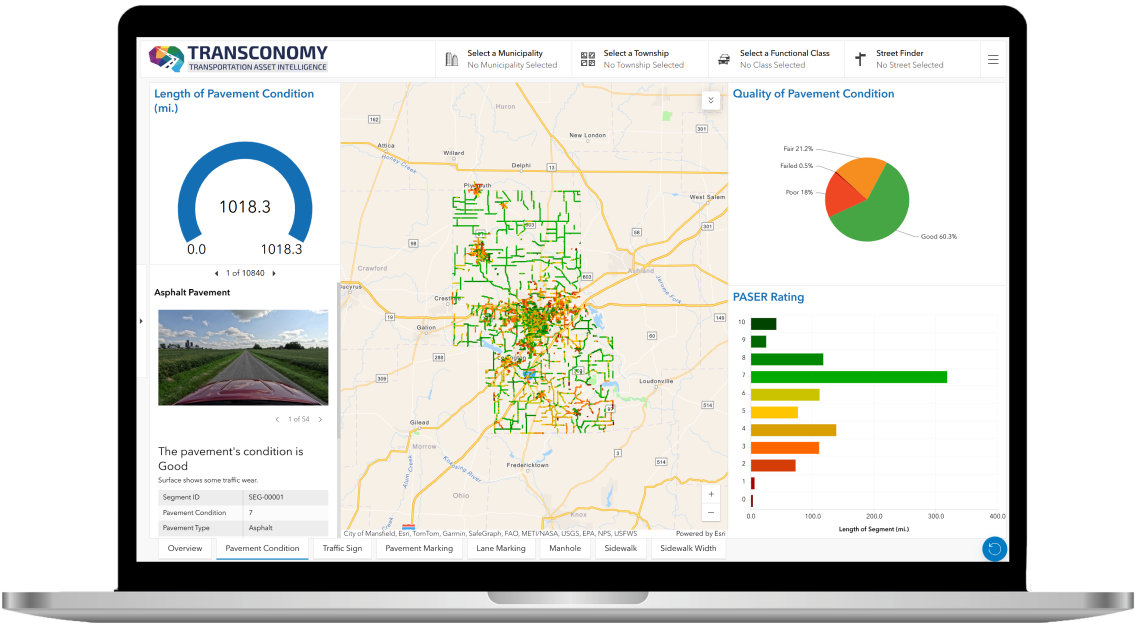
An ArcGIS Dashboard, Customized for You
Tailored filters, maps, and reporting that match your agency structure. Explore pavement, signs, transit routes, and more with interactive visualizations built for decision makers.


Import
Processed asset data is imported into ArcGIS dashboard

Visualize
Apply filters to see updated maps and metrics

Analyze
Use charts and imagery to explore individual asset issues

Decide
Prioritize maintenance and justify budgets
Key Features
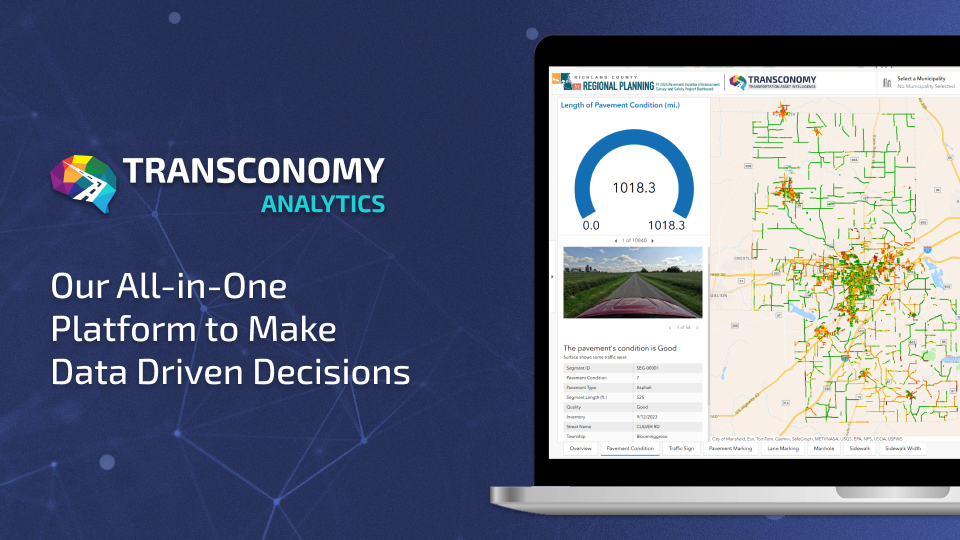
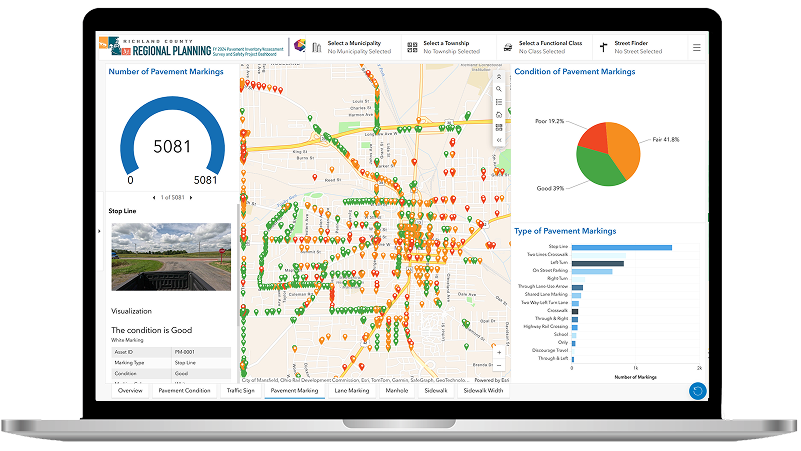
Transconomy Analytics transforms transportation asset data into actionable intelligence through an intuitive, ArcGIS-powered dashboard. Agencies can visualize roadway networks using interactive thematic maps with synchronized charts and quick filters, by municipality, township, functional class, or street name, for instant, focused analysis. The platform offers rich visual insights through gauges, pie and bar charts, and integrated asset imagery that validates conditions on the ground. With these insights, transportation professionals can confidently prioritize maintenance, optimize resources, and make data-driven decisions that enhance roadway performance and safety.